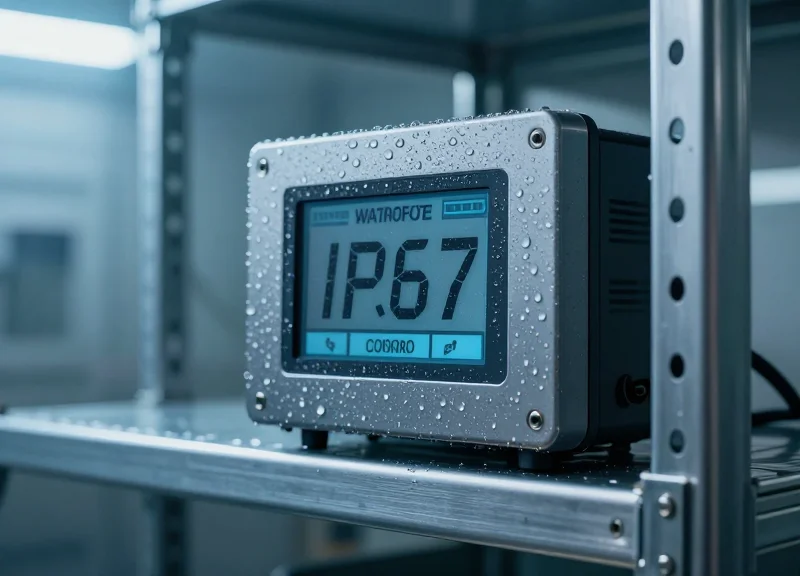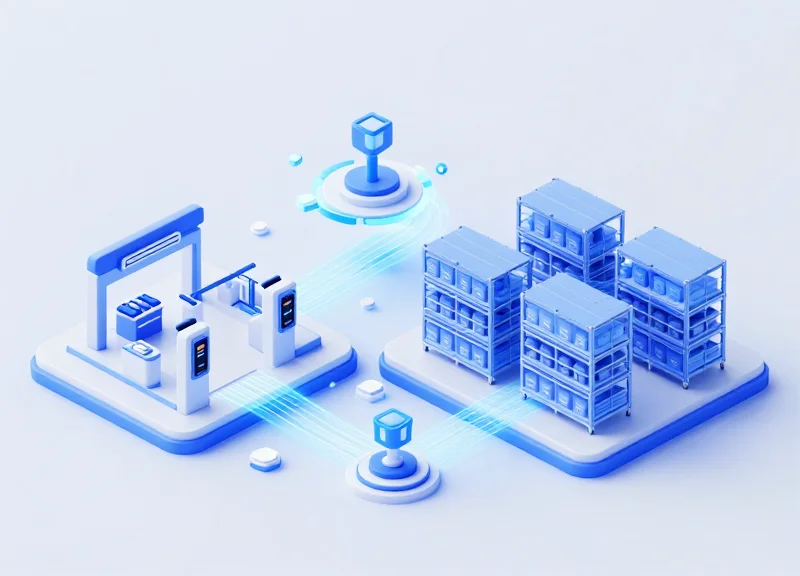
In large-scale RFID deployments spanning multiple continents, manual hardware monitoring is no longer a viable option. A single reader failure in a high-velocity warehouse or retail outlet can lead to significant data gaps, lost inventory tracking, and operational bottlenecks. This technical guide explores the transition from reactive maintenance to proactive, automated alerting systems, providing a roadmap for technical leaders to ensure their global RFID infrastructure remains resilient and operational 24/7.
The Evolution of RFID Infrastructure Management

RFID infrastructure management has transitioned from a model of reactive, localized troubleshooting—where technicians physically inspected hardware—to a proactive, cloud-native observability framework. Modern management now utilizes automated fault alerts and real-time telemetry to ensure 99.9% uptime across thousands of global endpoints, moving beyond simple 'heartbeat' pings to sophisticated state-aware diagnostics.
In the early stages of industrial RFID, management was siloed and labor-intensive. Readers were often managed via local serial connections or closed-circuit LANs. If a reader went offline in a warehouse in Singapore while the IT team was in Chicago, the failure might not be noticed until a critical shipment was missed. This lack of centralized visibility created massive bottlenecks as deployments scaled from a dozen readers to several thousand across multiple continents.
| Feature | Legacy Management (Pre-2015) | Modern Automated Management |
|---|---|---|
| Connectivity | Serial/Local LAN Only | Cloud-Native / MQTT / API-Driven |
| Monitoring | Manual 'Sneakernet' Checks | 24/7 Automated Real-time Alerts |
| Fault Detection | Physical LED Indicators | Virtual Heartbeats & State Telemetry |
| Scaling Capacity | Linear (More hardware = More staff) | Exponential (Software-defined scaling) |
| Recovery | Manual Power Cycling | Edge-Side Self-Healing Scripts |
The current standard for global enterprises is the 'Single Pane of Glass' approach. By integrating RFID readers into a centralized monitoring dashboard, organizations can now identify 'silent failures'—instances where a reader appears online but is failing to transmit tag data due to environmental interference or antenna degradation. This move toward deep observability is what separates market leaders from those struggling with operational debt.
What is the primary driver of this evolution?
The shift is driven by the need for 'Operational Elasticity.' As global supply chains become more volatile, manual monitoring cannot keep pace with the speed of data required for real-time inventory and logistics decisions.
How does cloud integration change the cost structure?
It shifts costs from high-frequency On-site Support (OpEx) to high-efficiency Software-defined Automation, drastically reducing the Total Cost of Ownership (TCO) over a 5-year deployment cycle.
What role does Edge Computing play in modern RFID?
Edge computing allows readers to process fault logic locally, meaning they can attempt self-remediation—like restarting a service—before even triggering a cloud-based alert.
Expert Insight: Avoid the 'Alert Fatigue' Trap. A common mistake in the evolution of RFID monitoring is over-alerting. In my 20 years of Silicon Valley experience, I've seen teams build monitoring that triggers an email for every minor packet drop. The key to successful evolution is not just alerting, but intelligent 'Event Correlation.' Ensure your system can distinguish between a local network flicker and a genuine hardware failure to prevent your engineering team from ignoring critical notifications.
Core Components of an Automated Alerting Architecture

A robust RFID fault-alerting architecture is a closed-loop system designed to detect, transmit, and process hardware anomalies in real-time. Unlike traditional manual monitoring, this architecture integrates the edge layer (readers and antennas), the communication layer (MQTT or HTTP/REST), and the application layer (middleware) to ensure that a hardware failure at a remote site triggers an actionable response within seconds. By shifting the 'intelligence' to the edge, organizations can maintain 99.9% uptime across thousands of global nodes without increasing manual oversight.
| Architecture Layer | Primary Function | Critical Technologies |
|---|---|---|
| Edge Hardware Layer | Fault Detection & Telemetry | GPIO, VSWR Sensors, PoE+ Diagnostics |
| Communication Layer | Payload Transport | MQTT (Pub/Sub), Webhooks, gRPC |
| Middleware / Orchestrator | Logic & Alert Routing | Node-RED, AWS IoT Core, Azure IoT Hub |
| Notification Layer | Human-in-the-Loop Integration | PagerDuty API, Slack Webhooks, SMS |
The Expert Perspective: The 'Silent Antenna' Trap. One of the most common failures in global RFID deployments isn't a dead reader, but a 'silent antenna'—where the reader remains online while a cable or port fails. A high-tier alerting architecture must monitor VSWR (Voltage Standing Wave Ratio). If the VSWR exceeds a specific threshold, it indicates an antenna disconnection or damage, even if the reader reports as 'Active.' Monitoring VSWR via firmware is the differentiator between basic connectivity checks and true operational visibility.
{
  "device_id": "RFID-RDR-NYC-042",
  "status": "alert",
  "error_code": "ANT_DISCON_04",
  "telemetry": {
    "vswr": 4.2,
    "cpu_temp": 65.5,
    "memory_usage": "42%",
    "uptime_seconds": 864000
  },
  "timestamp": "2023-10-27T10:15:30Z"
}
Why is MQTT preferred over HTTP for global RFID monitoring?
MQTT is a lightweight, bi-directional protocol that requires significantly less bandwidth and battery power. Its 'Last Will and Testament' (LWT) feature is critical for RFID; it allows the broker to automatically notify the system if a reader goes offline unexpectedly, providing an immediate fail-safe for remote global nodes.
What role does GPIO play in fault alerting?
General Purpose Input/Output (GPIO) ports can be wired to physical indicators like stack lights for on-site visual alerts, or connected to environmental sensors (like smoke or humidity detectors) that provide context to why a reader might be failing in a harsh warehouse environment.
How do you prevent 'Alert Fatigue' in large deployments?
Implement an 'Alert Suppression' logic at the middleware layer. This ensures that transient network blips don't trigger a flood of notifications. Alerts should only be escalated if a fault condition persists for a predefined 'soak time' (e.g., 60 seconds) or involves critical hardware failure.
Communication Protocols: Leveraging SNMP, MQTT, and REST APIs

To automate RFID fault alerts, you must establish a reliable 'language' between the edge reader and your monitoring dashboard. The three primary protocols used today are SNMP (Simple Network Management Protocol) for traditional IT infrastructure, MQTT (Message Queuing Telemetry Transport) for modern IoT scalability, and REST APIs for high-level management and configuration. Selecting the right protocol is not just a technical preference; it determines how your system handles high-latency global networks and whether your alerts arrive in milliseconds or minutes.
| Protocol | Communication Style | Best Use Case | Overhead |
|---|---|---|---|
| SNMP | Poll-based / Traps | Legacy enterprise IT & network hardware monitoring | Medium |
| MQTT | Publish/Subscribe | Real-time fault alerts in low-bandwidth/IoT environments | Extremely Low |
| REST API | Request/Response | Firmware updates & complex configuration management | High |
For global deployments where connectivity may be intermittent, MQTT is the industry gold standard. Unlike REST, which requires a persistent connection for every request, MQTT's 'Last Will and Testament' (LWT) feature provides an automated 'offline' alert if a reader loses power or network suddenly. This allows for proactive monitoring of 'silent failures' that standard polling might miss for several minutes.
{
  "device_id": "RFID-TX-049",
  "event_type": "FAULT_ALERT",
  "fault_code": "ANTENNA_DISCONNECT_E12",
  "severity": "CRITICAL",
  "timestamp": "2023-10-27T14:22:01Z",
  "diagnostic_data": {
    "port": 2,
    "vswr_value": 4.5
  }
}
Expert Insight: The Hybrid Approach. Avoid the 'one-protocol' trap. In high-performance Silicon Valley-engineered systems, we typically deploy a hybrid architecture: MQTT for high-frequency health 'heartbeats' and error traps, and REST APIs for the heavy lifting of pulling detailed diagnostic logs or pushing firmware patches. This maximizes bandwidth efficiency while ensuring deep visibility into the hardware stack.
Why should I use SNMP Traps instead of polling?
Polling creates unnecessary network traffic by constantly asking the reader if it is 'okay.' SNMP Traps are asynchronous notifications sent only when an event occurs, which is much more efficient for monitoring thousands of readers across a global WAN.
What is the 'Last Will and Testament' in MQTT?
LWT is a message defined at the start of a session that the broker will automatically publish if the reader disconnects unexpectedly. This is the fastest way to detect a power failure or a cut ethernet cable in a remote facility.
Can REST APIs handle real-time alerting?
While possible via Webhooks, REST is generally less efficient than MQTT for real-time streams. It is better suited for administrative tasks like retrieving the reader's inventory of connected antennas or updating security certificates.
Defining Critical Fault Thresholds and Event Triggers
Defining critical fault thresholds is the process of establishing the exact numerical boundaries—such as decibel loss, temperature Celsius, or millisecond latency—that trigger an automated alert. In global RFID deployments, these triggers must be categorized by severity to prevent 'alert fatigue,' ensuring that a minor transient fluctuation doesn't wake an engineer at 3:00 AM while a total antenna failure triggers an immediate failover response.
| Fault Category | Metric / Indicator | Critical Threshold (Trigger) | Severity Level |
|---|---|---|---|
| Hardware: Antenna | Return Loss (VSWR) | > 10dB or VSWR > 2.0 | High (Immediate Action) |
| Environmental: Thermal | Internal CPU Temp | > 85°C (185°F) | Critical (Automatic Shutdown) |
| Network: Latency | Heartbeat Response | > 500ms over 3 cycles | Medium (Log & Monitor) |
| System: Memory | RAM Utilization | > 90% for 5+ minutes | High (Preventative Reboot) |
Expert Insight: The 'Alert Debouncing' Strategy. To avoid false positives in high-interference industrial environments, never trigger an alert based on a single data point. Implement a sliding-window logic: only escalate an event if the threshold is breached for three consecutive 10-second polling intervals. This filters out 40-60% of 'ghost' alerts caused by temporary RF interference or minor network jitter.
- Identify Baseline Operating Conditions: Profile your readers in a healthy state for 48 hours to determine the 'normal' range for RSSI, CPU load, and network ping.
- Establish Warning vs. Critical Tiers: Set a 'Warning' threshold at 75% of the failure limit to allow for proactive maintenance before the system goes offline.
- Configure Event Persistence: Define how long a fault must persist before an alert is dispatched (e.g., an antenna disconnected for > 2 seconds).
{
  "alert_config": {
    "sensor_id": "RFID_READER_NYC_04",
    "thresholds": {
      "temp_critical_c": 85,
      "vswr_fault": 2.5,
      "latency_ms_max": 300
    },
    "trigger_logic": "persistent_3_cycles",
    "notification_channel": "webhook_pagerduty"
  }
}
What is the most common cause of false RFID alerts?
Antenna port 'noise' caused by nearby metal movement often triggers VSWR alerts. Using a 'settling time' of 500ms before reporting the fault typically resolves this.
How do I handle alerts for readers in areas with poor connectivity?
Use Edge-based thresholding. The reader should evaluate its own health locally and only push a 'Critical' summary packet via MQTT when the network is available, rather than streaming raw health data.
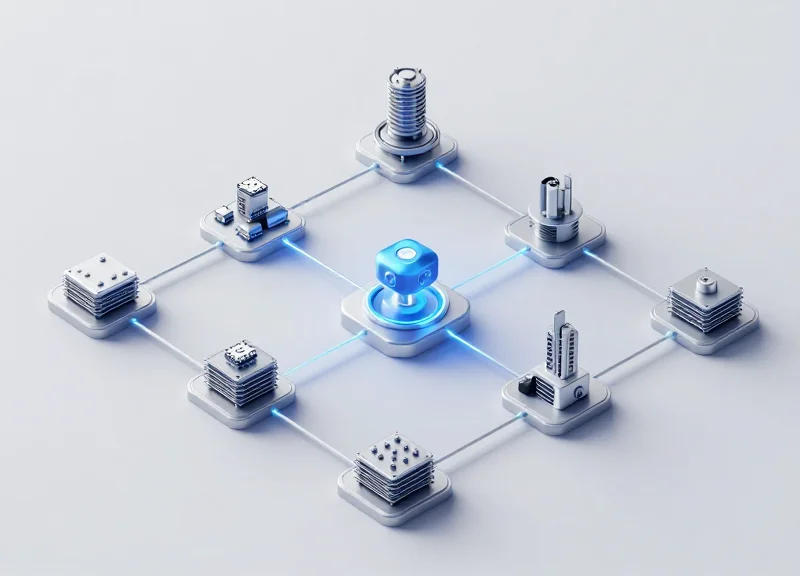
Centralizing Data: The Role of IoT Platforms in Global Monitoring

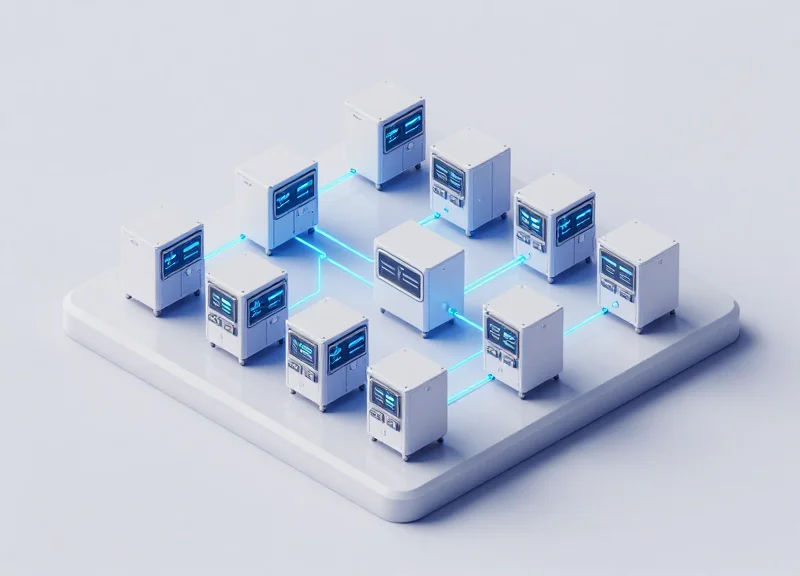
Centralizing data via an IoT platform is the process of aggregating real-time health metrics and fault logs from thousands of geographically dispersed RFID readers into a single, unified cloud interface. By moving away from localized, siloed monitoring, enterprises can apply global logic to reader performance, ensuring that a firmware bug in a Tokyo warehouse is identified and patched with the same urgency and protocol as a hardware failure in a London distribution center. This 'single pane of glass' architecture is essential for maintaining 99.9% uptime across massive, multi-tenant deployments.
| Feature | Localized/Siloed Monitoring | Centralized IoT Platform |
|---|---|---|
| Visibility | Site-by-site; fragmented data | Global; real-time unified dashboard |
| Scalability | Manual configuration per site | Automated provisioning for 10k+ devices |
| Alert Logic | Inconsistent across regions | Standardized global fault thresholds |
| Historical Analysis | Difficult to correlate trends | Rich data lakes for predictive maintenance |
- Device Provisioning and Secure Onboarding: Utilize X.509 certificates or TPM chips to securely register RFID readers to the IoT hub, ensuring only authorized hardware can stream telemetry.
- Data Normalization and Ingestion: Convert various vendor-specific outputs into a standardized JSON format at the edge or via cloud functions to ensure uniform data processing.
- Stateful Digital Twin Mapping: Create a virtual representation of every physical reader to track current status, configuration history, and environmental conditions in real-time.
- Stream Processing and Rule Execution: Apply real-time analytics to incoming telemetry to trigger immediate actions when telemetry deviates from the 'known-good' baseline.
Expert Insight: The Power of Stateful Monitoring. Generic monitoring often relies on 'stateless' alerts—reacting only to a single error message. A true IoT platform leverages 'stateful' monitoring via Digital Twins. This allows the system to distinguish between a transient network flicker and a terminal hardware failure by comparing the reader's current telemetry against its historical performance envelope and its neighbors' status. If one reader fails while others on the same subnet remain active, the platform can automatically isolate the fault to the specific RFID unit rather than the site network.
How does centralization handle high-latency connections?
Modern IoT platforms use 'Store and Forward' mechanisms at the edge, ensuring that fault logs are buffered locally and uploaded once connectivity is stabilized, preventing data loss.
Is it possible to manage multiple RFID brands in one platform?
Yes, by using an abstraction layer or IoT gateway that translates proprietary protocols into a common MQTT or HTTPS payload, you can monitor Zebra, Impinj, and Alien readers side-by-side.
What are the security implications of cloud centralization?
Data is typically encrypted in transit via TLS 1.2/1.3 and at rest. Centralization actually improves security by allowing for global, instant rotation of security keys across all readers.
Security Protocols for Remote Device Management
Security protocols for remote RFID management are the specialized cryptographic frameworks and network configurations—such as TLS 1.3, VPN tunneling, and OAuth 2.0—used to ensure that telemetry data and fault alerts remain confidential, integral, and authenticated. In a global deployment, these protocols prevent the remote monitoring link from becoming a back-door entry point into the corporate enterprise network, shielding hardware from unauthorized command injection or data snooping.
When managing thousands of readers across different continents, the 'security perimeter' no longer exists. Every reader must be treated as a standalone edge node. This requires moving beyond simple password protection toward a Zero Trust Architecture (ZTA). By implementing encrypted tunnels and robust identity management, organizations can ensure that a compromised reader in one warehouse cannot lead to a lateral movement attack across the entire global infrastructure.
| Protocol / Method | Primary Use Case | Security Strength | Network Overhead |
|---|---|---|---|
| mTLS (Mutual TLS) | Device-to-Cloud authentication via certificates | Very High | Low |
| IPsec VPN Tunnel | Securing communication over public internet | High | High |
| OAuth 2.0 / JWT | API-level authorization for fault reporting | Medium-High | Minimal |
| Private APN | Cellular-based isolation for remote sites | High | N/A (ISP Level) |
Expert Insight: The 'Hardware Root of Trust'. A common mistake in global RFID deployments is relying on software-level obfuscation. To truly secure 24/7 monitoring, utilize readers equipped with a Trusted Platform Module (TPM) or Secure Element (SE). This allows the device to store cryptographic keys in hardware, making it impossible for an attacker to clone the device's identity even if they have physical access to the reader's firmware.
- Implement Mutual TLS (mTLS): Ensure both the RFID reader and the monitoring server exchange digital certificates to verify identities before any data is transmitted.
- Enforce End-to-End Encryption: Use AES-256 for data at rest and TLS 1.2+ for data in transit to protect sensitive tag data and system health metrics.
- Rotate Credentials Programmatically: Avoid hard-coded API keys. Use automated secret management tools to rotate device passwords and certificates every 30-90 days.
- Segment the Management Traffic: Use VLANs or micro-segmentation to isolate RFID management traffic from the general guest Wi-Fi or primary corporate data streams.
Can I use SNMP v2 for remote monitoring?
No. SNMP v1 and v2 transmit data in cleartext. Always use SNMP v3, which supports encryption and MD5/SHA authentication for secure fault reporting.
Is a VPN required for all global deployments?
Not necessarily. While VPNs offer great security, they add latency. Many modern deployments prefer mTLS over HTTPS for a lighter, more scalable 'Direct-to-Cloud' architecture.
What is the biggest security risk in RFID monitoring?
The use of 'Default Credentials'. Many readers ship with factory-set admin passwords that are never changed, making them easy targets for automated botnet scans.
Streamlining Troubleshooting with Automated Diagnostic Workflows

Automated diagnostic workflows are self-healing protocols that bridge the gap between fault detection and human intervention. By integrating logic-based scripts directly into the monitoring layer, global RFID deployments can perform 'first-look' diagnostics—such as capturing heap dumps, checking antenna impedance, or executing soft resets—the millisecond a threshold is breached. This ensures that transient software glitches are resolved without manual tickets and that persistent hardware failures are documented with high-fidelity forensic data before the 'scene of the crime' is lost to a reboot.
- Trigger Validation: The system confirms the fault is not a false positive by cross-referencing multiple telemetry points (e.g., verifying a 'Reader Disconnected' alert against network pings).
- Pre-Remediation Snapshot: Before any reset occurs, the workflow executes a script to pull the last 1,000 lines of system logs and current memory utilization to preserve the state for root cause analysis.
- Tiered Remediation: The workflow attempts a non-disruptive fix first, such as restarting the LLRP (Low Level Reader Protocol) service, before escalating to a full system warm boot.
- Validation and Escalation: The system monitors the device for 300 seconds post-remediation; if the fault persists, it generates a high-priority ticket with the captured diagnostic bundle attached.
| Fault Type | Automated Diagnostic Action | Remediation Strategy |
|---|---|---|
| Antenna Mismatch | VSWR (Voltage Standing Wave Ratio) Test | Port Disable/Enable Cycle |
| Buffer Overflow | Tail -n 500 Log Export | Clear Cache / Service Restart |
| CPU Spike | Process List Capture (top/ps) | Kill Non-Essential Middleware |
| Network Latency | Traceroute to Management Server | Toggle Cellular/Ethernet Failover |
import requests

def auto_remediate_reader(reader_ip, fault_type):
    # Capture logs before reset
    log_data = requests.get(f'http://{reader_ip}/api/v1/system/logs')
    save_to_cloud(log_data, reader_ip)

    if fault_type == 'LLRP_TIMEOUT':
        # Target service restart instead of full reboot
        response = requests.post(f'http://{reader_ip}/api/v1/services/llrp/restart')
        return response.status_code == 200
    return False
Unique Insight: The 'Ghost in the Machine' avoidance strategy. Most engineers make the mistake of implementing 'reboot-only' automation. However, in large-scale deployments, frequent reboots can mask underlying power fluctuations or cable degradation. A truly sophisticated workflow utilizes 'Diagnostic Staging'—where the system intentionally delays a reboot by 30 seconds to run a low-level hardware self-test. This data is the difference between identifying a $5 frayed cable and unnecessarily replacing a $2,000 fixed reader.
Can automated scripts cause 'boot loops'?
Yes, if not properly throttled. Always implement a 'Max Retry' logic (e.g., 3 attempts in 1 hour) to prevent infinite loops that can overheat hardware.
Should diagnostic data be stored locally or centrally?
Centrally. If a reader's flash storage is failing, local logs will be corrupted. Stream diagnostic outputs to a centralized ELK stack or S3 bucket via MQTT.
What is the impact on network bandwidth?
Negligible. Log captures are typically small (KB), and because they only trigger on faults, the total data overhead remains low even in global deployments.
Optimizing Network Bandwidth for High-Density Deployments
In high-density RFID environments, network bandwidth optimization is the process of minimizing the data footprint of health-check 'heartbeats' and fault alerts to prevent congestion. This involves transitioning from continuous polling to event-driven reporting and implementing 'Edge Intelligence' to filter redundant status updates before they leave the local area network (LAN). By calibrating report intervals and payload sizes, enterprises can scale from ten to ten thousand readers without incurring prohibitive data costs or degrading mission-critical application performance.
The primary challenge in global deployments is the 'Thundering Herd' effect. When hundreds of readers are configured to check in at the exact same interval (e.g., every 60 seconds), they can simultaneously flood the gateway, causing packet loss and false-positive fault alerts. To solve this, technical architects must move beyond static configurations and embrace adaptive monitoring strategies.
| Protocol | Overhead (Bytes) | Best Use Case | Bandwidth Impact |
|---|---|---|---|
| MQTT (Binary) | 2-5 Bytes | High-density, low-latency monitoring | Minimal |
| HTTP/REST (JSON) | 200-500 Bytes | Small deployments, legacy systems | Moderate to High |
| SNMP Traps | Variable | General network health monitoring | Low |
| CoAP | 10-20 Bytes | Extremely resource-constrained devices | Very Low |
Expert Tip: The 'Jittered Heartbeat' Strategy. One of the most common mistakes in RFID management is setting a uniform heartbeat timer across the fleet. Instead, implement a 'jitter' variable—a randomized offset of ±10% to each reader's report interval. This desynchronizes the traffic, smoothing out bandwidth spikes and ensuring the cloud infrastructure processes a steady stream of data rather than massive, intermittent bursts.
- Implement Delta-Based Reporting: Only transmit the full configuration state if a change is detected. Otherwise, send a 'Keep-Alive' bit which uses less than 1% of the bandwidth of a full status report.
- Leverage Protocol Buffers (Protobuf): Switch from verbose JSON strings to Google’s Protobuf or other binary formats to compress payloads by up to 80% without losing data integrity.
- Edge-Side Fault Aggregation: Use an onsite edge gateway to aggregate alerts from multiple readers. If 50 readers lose connectivity due to a switch failure, the gateway sends one 'Network Down' alert instead of 50 individual 'Reader Offline' messages.
How does reader density affect latency?
As reader density increases, the probability of collisions at the network layer rises. This increases 'Tail Latency,' where fault alerts might take several seconds longer to reach the dashboard, potentially delaying emergency shutdowns.
Should I use VPNs for heartbeat data?
While secure, VPN overhead (IPsec/OpenVPN) can add 50-100 bytes to every packet. For high-density monitoring, consider TLS-encrypted MQTT (MQTTS), which provides security with significantly lower overhead.
What is the ideal heartbeat frequency?
For mission-critical assets, 30 seconds is standard. For general inventory, 5 to 15 minutes is sufficient. Always use 'Event-Driven' alerts for critical faults (like antenna disconnects) to bypass the heartbeat timer entirely.
Future-Proofing Your RFID Ecosystem with AI-Driven Predictive Maintenance

AI-driven predictive maintenance for RFID ecosystems is the process of using machine learning models to analyze telemetry data—such as RSSI fluctuations, ambient noise levels, and internal component temperatures—to forecast hardware failures before they disrupt operations. Unlike traditional threshold-based alerts that trigger after a failure occurs, predictive maintenance identifies subtle 'signal degradation signatures' that indicate a component is trending toward a breakdown, allowing for scheduled intervention during non-peak hours.
| Maintenance Strategy | Triggers | Downtime Risk | Operational Impact |
|---|---|---|---|
| Reactive | Hard failure (e.g., Reader Offline) | High | Emergency repairs, lost productivity |
| Scheduled | Fixed time intervals (e.g., 6 months) | Low/Medium | Inefficient; parts replaced too early |
| AI-Predictive | Anomalous data patterns (ML-driven) | Minimal | Optimized lifespan, proactive part ordering |
The Veteran's Insight: Detecting 'Impedance Drift' In my two decades of infrastructure monitoring, the most overlooked predictor of RFID failure isn't a sudden disconnect—it's 'Impedance Drift.' Over time, moisture ingress in coaxial cables or micro-fractures in antenna housings cause gradual shifts in the reflected power (VSWR). While the reader still functions, an AI model can detect this specific trend long before the hardware hits a 'critical' error threshold. Monitoring this delta is the difference between a global rollout that lasts three years versus one that lasts ten.
- Telemetry Harvesting: Aggregate high-granularity logs including LBT (Listen Before Talk) failure rates, CPU utilization spikes, and power consumption per port.
- Feature Engineering: Normalize raw data to account for environmental variables like facility temperature shifts or high-density metal interference.
- Anomaly Detection Training: Deploy Unsupervised Learning models (like Isolation Forests) to establish a 'normal' baseline for each specific deployment site.
- Automated Ticket Generation: Integrate ML outputs with ITSM tools (like ServiceNow) to trigger low-priority maintenance tickets when failure probability exceeds 85%.
Can AI help with read-rate optimization?
Yes. Beyond hardware health, ML can analyze Tag-to-Reader ratios to predict when environmental changes (like new racking or machinery) are degrading read accuracy, prompting a remote power adjustment.
Does this require a GPU at the edge?
Usually no. Most predictive RFID models are light enough to run on standard IoT gateways or as centralized cloud functions, as they process metadata rather than raw RF waves.
What is the typical ROI for AI maintenance?
Enterprises typically see a 25-30% reduction in field service costs and a significant increase in hardware MTBF (Mean Time Between Failures) by preventing thermal stress damage.